Software Hut Project
Individual Grade Achieved: 95%
Software Hut Prize (Client Awarded)
For this project, my team and I were tasked with creating a system that our client could ‘interrogate for data’ about various golf courses. During the course of our weekly client meetings, we captured his requirements in the form of story cards and mockup diagrams. The outline of the system is as follows: there are two main roles - map creators and regular users. The role of map creators is to create detailed maps of the holes of golf courses, which can then be utilised by regular users in optimising their golf game in a data-driven manner, using the strokes gained metric.

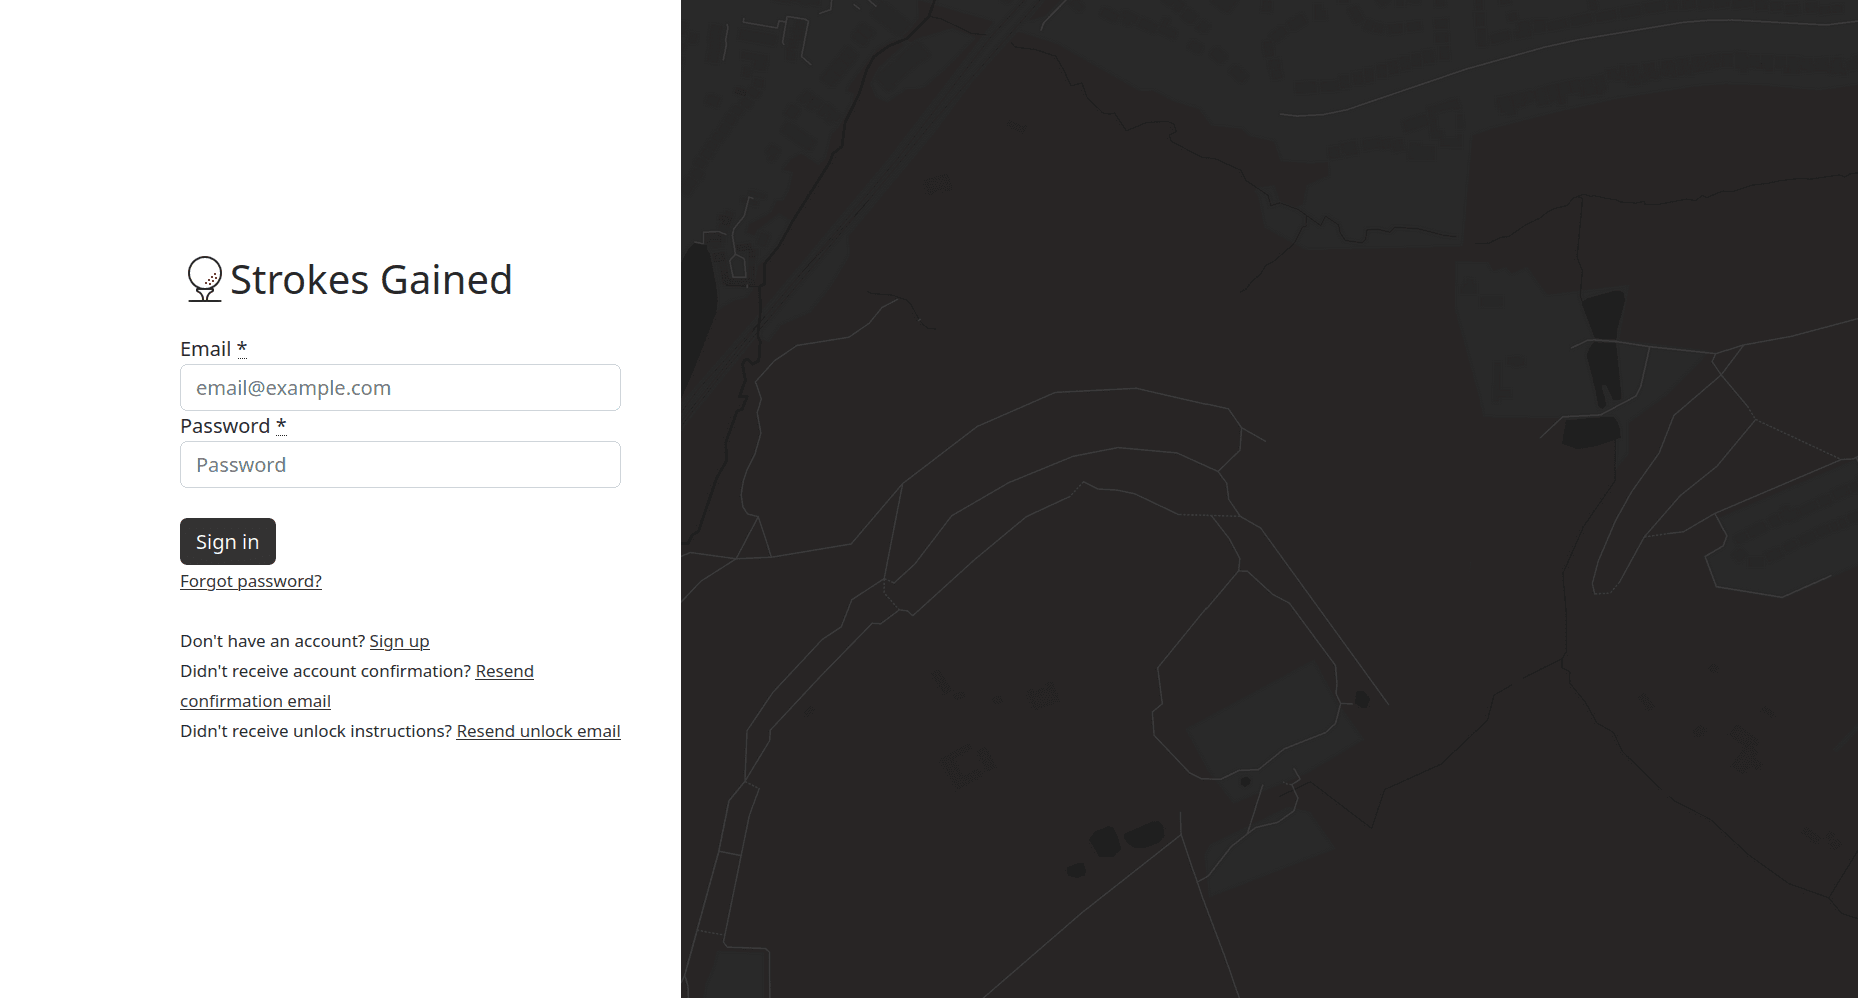
The login page of my team's software hut project
An example of how a map creator might use the system.
My main role in the project was programming the map interactions - such as the above page. In order to do this I used Leaflet to create the base map, and Leaflet Geoman to allow the map creator to draw on the map. Using geoman, I was able to create a variety of different custom polygon drawing controls - one for each of the terrain types that we agreed on with our client. These are all styled with custom CSS to create the look of our application, using SCSS variables for all of the terrain colours, in order to keep a consistent look between what is displayed on the sidebar, and what is drawn on the map. Map creators can also change the ‘tag’ of the map (for example, from ‘In Development’ to ‘Complete’). This will control what regular users can see, as they are only permitted to view courses that are marked as ‘Complete’. Once done, they can save their changes, which will be written to the database. I used the Overpass Turbo API to pre-populate the database with the locations and outlines of every golf course that is marked on openstreetmap, meaning the only thing that map creators had to do was draw the detail on the holes.
I also wrote the page for users to annotate the map, which is identical to this one and therefore is not shown on this page. The only difference between this and the annotation page is the fact that when a user presses the save button, the map is not saved to the global ‘courses’ database, but rather to the user's own ‘annotations’ table within the database.
An example of how a user might use the system.
Programming the above page was another of my responsibilities over the course of the project, as it was mainly map interaction. Users can select their starting point, and then click around on the map to see how many strokes they would gain/lose if their shot followed the displayed white line. They can also toggle their shot dispersion for a specific club (the script for this was written by one of my teammates), to see whether their selected aiming point is realistic for them. The main part of this page, which was initially set by our client as a most-likely unreachable target, is the shot optimisation aspect. As shown in the above video, users can click on a button which will run an algorithm to determine their best shot from their current position, and have that displayed on the map.
The algorithm that I wrote for this essentially takes a random sample of points across the user's dispersion for a club (1 point for every square metre), calculates the average strokes gained for each aiming point within a 150° cone, centered on the hole (as it is highly unlikely that the optimal shot will be outside of that range, and limiting the search range speeds up the algorithm massively), and outputs the club/aim point combination that produces the best average strokes gained. The algorithm also takes into account trees - if the shot being checked starts or ends less than 20m from a tree that that the line of the shot intersects, it is assumed that that tree will be blocking the shot, and therefore that shot is discarded. However, this only works if a tree has been marked on the map - either by the map creators, or by the user themselves in their annotations. The 20m threshold is somewhat arbitrary - it is the distance that a ball would need to travel to clear a 20m high tree, assuming the ball is travelling at 45°. This could be improved by allowing the map creator to change the height of the trees that they are marking, and then checking the shot line against individual tree heights, rather than assuming that all trees are 20m tall.